State statistics Committee regularly monitors the status of Ukrainian households. To official figures in our country traditionally skeptical, but the latest statistics, at least, does not contradict the usual for many Ukrainians the image of the world.
Overall rating
The average size of Ukrainian households remains unchanged for many years to 2.6 people In this somewhat reduced the share of “sole” farms becomes more pairs. Virtually unchanged, the share of families with children – 38%. The number of families with one child is increasing, and with two and three decreases.
Household characteristics
2010
2013
2014
2015
2016
Average size person.
2,59
2,58
2,58
2,59
2,58
Distribution by number of people %
one
23,4
22,6
22,8
20,3
19,7
two
28,3
29,1
29,6
32,5
32,3
three
25,5
26,9
25,3
25,9
26,9
four and more
22,8
21,4
22,3
21,3
21,1
With children under 18 years, %
37,9
38,0
38,0
The 38.2
The 38.2
Distribution by number of children %
one
73,6
75,4
73,6
75,7
76
two
23,4
22,4
23,3
21,2
21,4
– three or more
3
2,2
3,1
3,1
2,6
Nominal aggregate income and expenditure of households grow naturally. But in 2010, revenues exceeded expenses by 9.6%, in 2016 – by 6.6%, that is less money left to accumulation.
Total monthly resources and expenditures per household, UAH
2010
2013
2014
2015
2016
Resources
3481
4470,5
4563,3
5231,7
6238,8
Income
3369,8
4331
4470,9
5122
6095
Costs
3073,3
3820,3
4048,9
4952
5720,4
Year total resources is almost entirely determined by money income. But in 2016 the share of income declined from the average by 4 percentage points (PP), which went largely to benefits and subsidies.
The structure of the resources of households, %
2010
2013
2014
2015
2016
Cash income
89,1
90,8
91,2
89,4
86,0
– wages
47,6
50,6
48,8
47,2
46,7
– from entrepreneurship and self-employment
6,1
4,1
5,2
5,5
5,2
– from the sale of agricultural products
3,4
2,8
3,2
3,4
2,9
– pensions, scholarships, social assistance
25,8
27,1
27,0
25,2
23,1
– help from relatives, etc.
6,2
6,2
7,0
8,1
8,1
The cost of consumed products received from personal services
5,0
3,9
4,6
5,1
4,8
Benefits and housing subsidies
0,6
0,4
0,4
1,3
4,7
Other benefits
0,5
0,5
0,4
0,4
0,4
Other receipts
4,8
4,4
3,4
3,8
4,1
Household spending
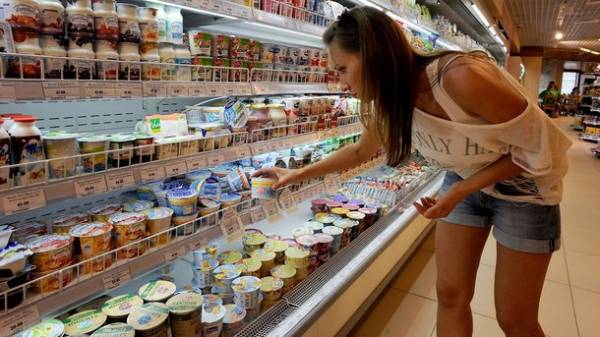
The share of consumer spending is slowly but steadily growing from year to year. The share of expenditure on food over the past year decreased significantly, largely due to rising costs for housing, gas and electricity.
Despite the significant increase in retail prices for household items and appliances (they are largely tied to the dollar), the share of costs attributable to these categories of goods declined. This indicates a significant drop in sales in the physical dimension.
Over the past year significantly decreased and the share of expenditure on alcohol and tobacco – again, despite the increase in their prices. The reason for this drop in the consumption of these product categories.
State statistics service has calculated separately the proportion of expenditure on housing and utilities. In 2010 it was 7.6%, and in 2016 already is 14.7%. Given the rise in tariffs, such result is natural.
The structure of expenditure in households, %
2010
2013
2014
2015
2016
Consumer spending
89,9
90,2
91,6
92,9
93,2
food
51,6
50,1
51,9
53,1
49,8
alcohol and tobacco
3,4
3,5
3,4
3,3
2,9
non-food goods and services
34,9
36,6
36,3
36,5
40,5
including:
– clothes and shoes
6,0
5,9
6
5,7
5,6
– housing, gas, energy
9,2
9,5
9,4
11,7
16
– household items, appliances
2,3
2,3
2,3
2,0
1,7
health
3,2
3,4
3,6
3.7 V
4,2
– transport
3.7 V
4,3
4,3
3.7 V
3,6
connection
2,7
2,8
2,8
2,4
2,3
– leisure and culture
1,8
2,1
1,8
1,5
1,4
– education
1,3
1,2
1,1
1,1
1
Non-use costs
The 10.1
9,8
8,4
7,1
6,8
Average consumption of Ukrainians the main food categories in physical terms the last five years remains almost stable.
SEE ALSO
- Do Ukrainians eat more Europeans (infographic)
Due to the cost of steel has a little less meat and fish, the volume of consumption remains substantially below the recommended by nutritionists.
Food consumption in households (average per month per person, kg)
2010
2013
2014
2015
2016
Meat and meat products
5,1
5,1
4,9
4,6
4,7
Milk and dairy products
19,2
20,3
20,3
19,8
19,6
Eggs, PCs.
20
20
20
19
19
Fish and fish products
1,8
1,8
1,6
1,2
1,2
Sugar
3,0
3,0
3,0
2,8
2,7
Vegetable oil
1,8
1,7
1,7
1,6
1,5
Potatoes
7,7
7,1
6,9
6,6
6,7
Vegetables and melons
9,5
9,4
9,0
8,8
9,2
Fruits, berries, nuts
3.7 V
4,1
3.7 V
3,1
3,3
Bread and bakery products
9,3
9,0
9,0
8,5
8,3
The level of income
At the end of last year, the biggest proportion of the population (17.7 percent) had a median equivalent income exceeding 3 720 UAH per month, increased the proportion of all categories receiving more than 2 280 UAH. These data correlate with the dynamics of the average income. But we are talking about nominal income, which does not take inflation into account. Even so by itself, this growth says little about changing the material conditions of the population.
The structure of the population by per capita equivalent income, %
Income per month, UAH
2010
2013
2014
2015
2016
up to 480
0,7
0,1
0,1
0,1
0,0
480,1–840
7,8
2,3
1,4
0,9
0,3
840,1–1200
25,9
9,1
7,9
4,8
1,6
1200,1–1560
27,2
21,2
19,2
11,3
5,0
1560,1–1920
16,5
21,9
23,1
18,2
11,5
1920,1–2280
21,9
16,6
16,5
17,6
16,0
2280,1–2640
…
10,5
11,7
15,9
16,4
2640,1–3000
…
6,8
7,8
11,4
13,6
3000,1–3360
…
4,3
4,6
6,7
10,0
3360,1–3720
…
2,0
2,5
4,4
7,9
more than 3720
…
5,2
5,2
8,7
17,7
However, the SSS results and more useful for this assessment, data on the dynamics of the proportion of the population that receives income below the subsistence minimum, with both the official and the actual. According to them, half of the Ukrainians in 2015 and 2016 had incomes below the actual subsistence minimum.
Population with income below subsistence minimum, %
2010
2013
2014
2015
2016
Below the official level, mln.
3,6
3,5
3,2
2,5
1,5
from the total population, %
8,6
8,3
8,6
6,4
3,8
Below the actual level, mln.
…
…
6,3
20,2
19,8
from the total population, %
…
…
16,7
51,9
51,1
Average actual subsistence minimum, UAH per month
…
…
1357,6
2257,0
2646,4
All figures gosstat results excluding the territory of the annexed Crimea and Sevastopol and part of the zone of the ATO (as of 2014).